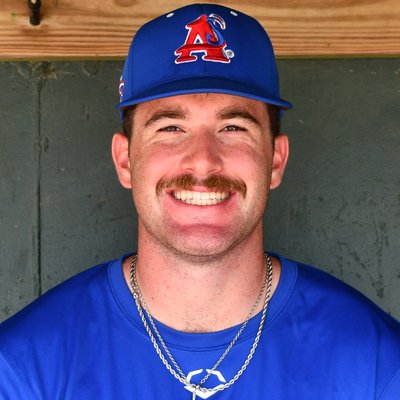
Colin Fisher
School
Arkansas
Born
2004-09-21
Hometown
Norman, OK
Bats / Throws
L/L
Height / Weight
6-3
· 225
Drafted
2026
· Rd 13
(#388 overall)
· San Francisco Giants
Cape League Pitching (expand stats for Game Logs)
2025 — Bourne Braves · Arkansas
2026 — Chatham Anglers · Arkansas
| Date | Team | Opp | Result | Dec | GS | IP | AB | BF | H | R | ER | HR | BB | IBB | SO | HBP | SH | SF | WP | BK | ERA | WHIP | K/9 | BB/9 | FIP | ERA+ |
|---|---|---|---|---|---|---|---|---|---|---|---|---|---|---|---|---|---|---|---|---|---|---|---|---|---|---|
| 2025 | ||||||||||||||||||||||||||
| Season Total 1-1 | 3 | 17.2 | 62 | 76 | 13 | 12 | 12 | 1 | 11 | 0 | 21 | 3 | 0 | 0 | 1 | 0 | 6.11 | 1.36 | 10.70 | 5.60 | 4.22 | 66 | ||||
| 2026 | ||||||||||||||||||||||||||
| Season Total 1-1 | 3 | 15.1 | 59 | 67 | 12 | 10 | 8 | 1 | 6 | 0 | 9 | 2 | 0 | 0 | 1 | 1 | 4.70 | 1.17 | 5.28 | 3.52 | 4.80 | 87 |
Pitching
Pitching
xwOBA Against
53
0.341
xBA Against
63
0.215
xSLG Against
37
0.353
Exit Velo Against
46
81.1 mph
Hard-Hit % Against
40
20.0%
Ground Ball %
87
60.0%
K %
10
14.8%
BB %
52
9.9%
Whiff %
16
20.4%
Chase %
38
24.1%
Fastball Velocity
54
91.2 mph
Run Value/100
25
-1.08
Pitch-level percentiles vs. 2026 qualified pitchers (min 50 pitches); K%/BB% vs. qualified pitchers (min 8 IP); bar = percentile rank, value on right = actual stat
Pitch movement (catcher's-eye view, inches)
| Pitch | Usage% | Velo | Spin | iVB | HB | Whiff% |
|---|---|---|---|---|---|---|
| ● Sinker | 31.8% | 91.1 | 2377 | 8.0 | -15.2 | 11.4 |
| ● Curveball | 25.5% | 78.2 | 2811 | -10.2 | 16.7 | 35.3 |
| ● Fastball | 22.7% | 91.2 | 2393 | 9.4 | -14.2 | 4.3 |
| ● ChangeUp | 12.3% | 85.8 | 1524 | 4.1 | -12.9 | 28.6 |
| ● Slider | 7.7% | 84.2 | 2338 | 2.2 | 4.4 | 40.0 |
| BA | SLG | wOBA | |
|---|---|---|---|
| Actual | 0.203 | 0.305 | 0.311 |
| Expected (x) | 0.215 | 0.353 | 0.341 |
| Diff | -0.012 | -0.048 | -0.030 |
Expected stats allowed, from the same k-nearest-neighbor model on exit velo + launch angle (59 AB against) — negative diff (blue) means outperforming quality of contact allowed (limiting hits below what the contact deserved), positive (red) means getting unlucky/hit hard
Rolling velo by game (2026-06-14 – 2026-06-29)
Run Value/100 replicates MLB's own published methodology: a count-conditioned run-expectancy model (base-out state × ball-strike count, same RE24 approach as the baserunning model but extended to the pitch level) values every single pitch, not just PA outcomes — a called strike moving the count from 1-1 to 1-2 has real value even though nothing "happened." Doesn't use Trackman at all, just play-by-play + pitch sequencing, so it isn't restricted to Trackman-covered games the way most of this section is. The Fielding row is a range-runs estimate: batted balls are bucketed by position + Trackman-derived difficulty (hang time/distance/exit velo, same buckets as the baserunning model), and the fielder — parsed directly from that specific play's PBP description, not a per-game starting lineup — is credited or debited the run-value gap between the bucket's expected out rate and what actually happened. Barrel% uses MLB's actual published EV/launch-angle lookup table — a ball must be hit 98+ mph, with the qualifying launch-angle window widening as EV climbs (a tight 26-30° band right at 98 mph, up to a wide 8-50° band at 116+ mph); Solid Contact % is a CCBL-only complement using that same table shifted 10 mph lower (88+ mph and up), since MLB's absolute 98+ mph Barrel threshold leaves ~70% of CCBL hitters flat at 0%. Hard-Hit % is exit velo alone, no launch-angle requirement: 95+ mph off the bat. xBA/xSLG/xwOBA use a k-nearest-neighbor model on this season's own batted balls, not MLB's own published model or league-wide MLB data — those, Fielding, and Run Value should be read as CCBL-relative, not compared directly to MLB's own advanced tracking numbers.