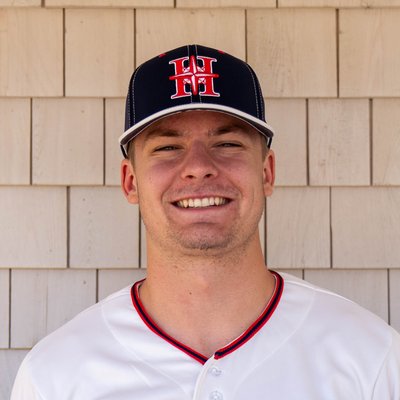
Jackson Hotchkiss
School
Washington
Born
2006-04-06
Hometown
Battle Ground, WA
Bats / Throws
R/R
Height / Weight
6-3
· 190
Drafted
2024
· Rd 18
(#554 overall)
· Arizona Diamondbacks
Cape League Batting (expand stats for Game Logs)
2026 — Harwich Mariners · Washington
| Date | Team | Opp | Result | Pos | PA | AB | R | H | TB | 2B | 3B | HR | RBI | SH | SF | HBP | BB | IBB | SO | SB | CS | GIDP | PO | A | E | DP | AVG | OBP | SLG | OPS | wOBA | wRC+ |
|---|---|---|---|---|---|---|---|---|---|---|---|---|---|---|---|---|---|---|---|---|---|---|---|---|---|---|---|---|---|---|---|---|
| 2026 | ||||||||||||||||||||||||||||||||
| Season Total | 63 | 55 | 11 | 13 | 22 | 3 | 0 | 2 | 10 | 0 | 1 | 0 | 7 | 0 | 24 | 6 | 1 | 1 | 21 | 0 | 0 | — | 0.236 | 0.317 | 0.400 | 0.717 | 0.367 | 117 |
2026 Advanced Metrics (Trackman)
Batting
Value breakdown:
Hitting +1.1
Baserunning +2.5
Fielding +0.2
=
Total +3.9 runs
Hitting = pitch-by-pitch Run Value at the plate; Baserunning = BsR; Fielding = range runs at their position. Each independently computed, summed here for a total runs-above-average estimate.
Hitting
xwOBA
84
0.387
xBA
42
0.218
xSLG
95
0.445
Exit Velocity
100
91.8 mph
Barrel %
86
3.2%
Solid Contact %
99
29.0%
Hard-Hit %
96
38.7%
K %
5
38.1%
BB %
48
11.1%
Whiff %
14
36.7%
Chase %
35
28.5%
wRC+
74
117
Hitting Run Value/100
62
+0.41
Running
Baserunning (BsR)
90
+2.5
Fielding
Fielding Run Value (LF)
52
+0.2
wRC+/BsR vs. 2026 qualified hitters (min 20 PA); Fielding vs. qualified fielders (min 20 plays) at the same position; batted-ball percentiles (min 15 BBE); bar = percentile rank, value on right = actual stat
Batted-ball spray chart — Whitehouse Field
● HR
● 3B
● 2B
● 1B
Some games have no Trackman tracking data at all — hits from those games won't appear here, even if they show up in the player's official stats.
| BA | SLG | wOBA | |
|---|---|---|---|
| Actual | 0.255 | 0.431 | 0.393 |
| Expected (x) | 0.218 | 0.445 | 0.387 |
| Diff | +0.037 | -0.014 | +0.006 |
Expected stats from a k-nearest-neighbor model on exit velo + launch angle (51 AB) — positive diff (red) means outperforming quality of contact, negative (blue) means getting unlucky
Rolling exit velo by game (2026-06-25 – 2026-07-12)
Run Value/100 replicates MLB's own published methodology: a count-conditioned run-expectancy model (base-out state × ball-strike count, same RE24 approach as the baserunning model but extended to the pitch level) values every single pitch, not just PA outcomes — a called strike moving the count from 1-1 to 1-2 has real value even though nothing "happened." Doesn't use Trackman at all, just play-by-play + pitch sequencing, so it isn't restricted to Trackman-covered games the way most of this section is. The Fielding row is a range-runs estimate: batted balls are bucketed by position + Trackman-derived difficulty (hang time/distance/exit velo, same buckets as the baserunning model), and the fielder — parsed directly from that specific play's PBP description, not a per-game starting lineup — is credited or debited the run-value gap between the bucket's expected out rate and what actually happened. Barrel% uses MLB's actual published EV/launch-angle lookup table — a ball must be hit 98+ mph, with the qualifying launch-angle window widening as EV climbs (a tight 26-30° band right at 98 mph, up to a wide 8-50° band at 116+ mph); Solid Contact % is a CCBL-only complement using that same table shifted 10 mph lower (88+ mph and up), since MLB's absolute 98+ mph Barrel threshold leaves ~70% of CCBL hitters flat at 0%. Hard-Hit % is exit velo alone, no launch-angle requirement: 95+ mph off the bat. xBA/xSLG/xwOBA use a k-nearest-neighbor model on this season's own batted balls, not MLB's own published model or league-wide MLB data — those, Fielding, and Run Value should be read as CCBL-relative, not compared directly to MLB's own advanced tracking numbers.